Generating Sample Points
Generating sample datasets is useful for testing and visualization.
For example, it’s easier to deterministically generate one million points
on a sphere than include a file containing those points.
Included with QLSC is a function called sunflower_points_on_sphere which generates
the specified number of points roughly evenly distributed on a sphere. (The code is taken
from this Stack Overflow answer.)
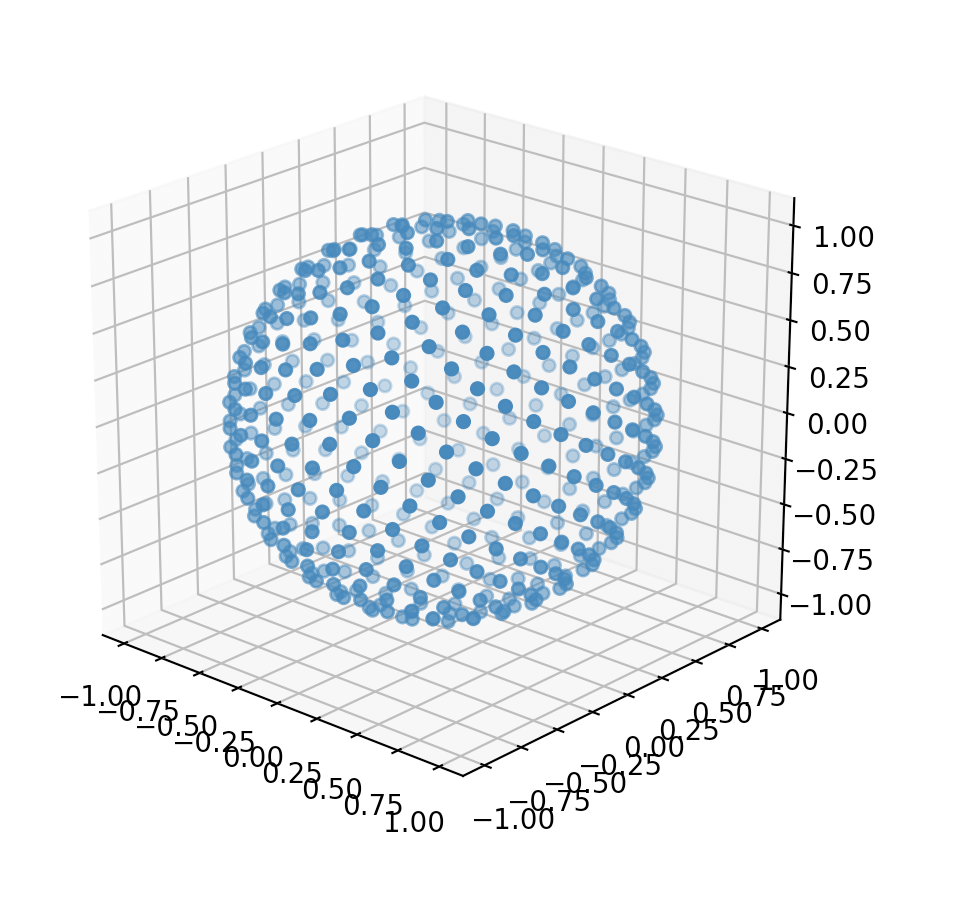
The format of the points can be returned as appropriate for their use case. For example, it’s convenient to return the values in radians for plotting. This is a simple example that generates 1000 points and plots them:
import numpy as np
from math import pi
import matplotlib.pyplot as plt
from mpl_toolkits.mplot3d import Axes3D

from qlsc.generate import sunflower_points_on_sphere

# generate points for plotting
points = sunflower_points_on_sphere(n=500, radians=True)
# convert points to (x,y,z) to plot
phi   = points[:,1] # math convention
theta = points[:,0]
x = np.sin(theta) * np.cos(phi)
y = np.cos(theta) * np.cos(phi)
z = np.sin(phi)
plt.figure().add_subplot(111, projection='3d').scatter(x, y, z);
plt.show()
which produces: